GALLERY
Direct PIHM simulation are base on plain text files. A post-processing module is developed to visulize the data through web page.
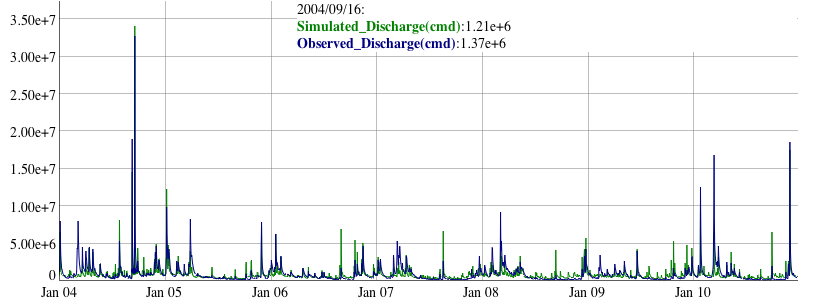
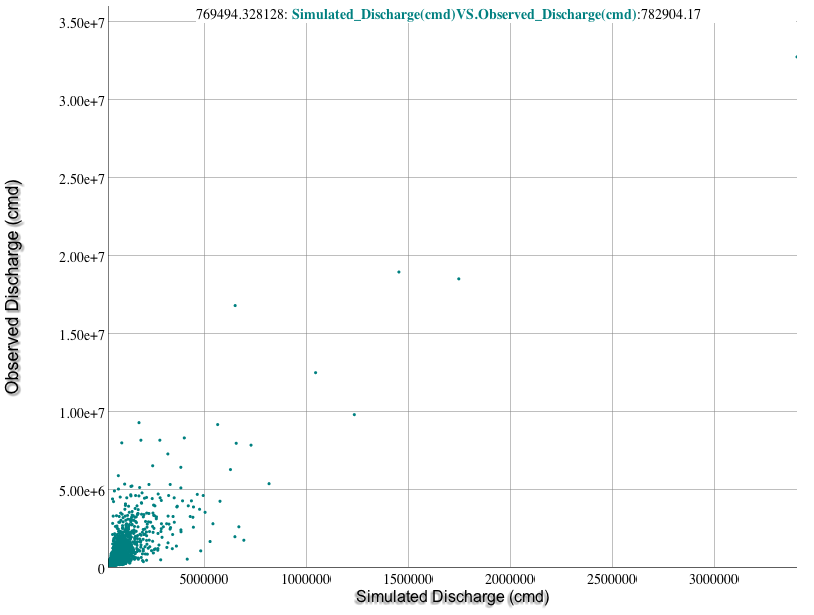
| PIHM input and output data are displayed by dynamic charts: |
| Time series is visualized by dygraphs JavaScript Visualization Library |
| Daily mean water budget of : Young Womans Creek Shale Hills |
 |
 |
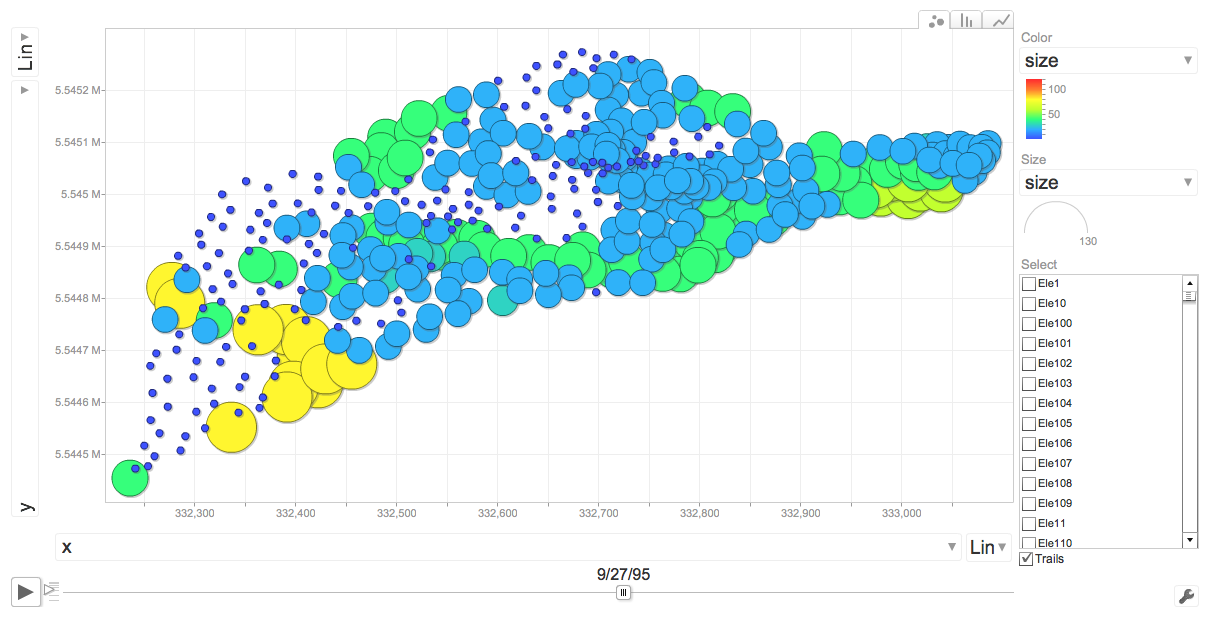
| Spatial variation is visualized by Google chart |
| Inter annual vegetation dynamics at Lysina, Czech |
 |